Checking your license...
Your NinjaTrader 8 tools
Every NinjaTrader 8 tool your plan includes, in one place. Licenses are tied to the email you log into NinjaTrader with.
On TradingView? Your scripts are added to your TradingView account automatically when you join. Nothing to download here.
Core
Included indicators
Each tool is its own .zip. Don't unzip it. Control Center → Tools → Import → NinjaScript Add-On, then restart NinjaTrader.
Set it up, start to finish
About 10 minutes. Four stages. Do it once.
- 01InstallDownload the zip. Tools → Import → NinjaScript Add-On. Restart.
- 02Chart settingsMerge non back adjusted. 5 min, Last, 365 days, ETH. Save as default.
- 03Add the strategyCheck Variant, Risk, DLL, Auto Trade, Account. Enable. Save workspace.
- 04Check and go liveDashboard clean. Watch it on Sim first. Then live.
What you need
- NinjaTrader 8, version 8.1 or later. A free NinjaTrader account works.
- An active license on the same email you log into NinjaTrader with. Your license card above shows which email it's on.
- MNQ or NQ futures data from a connected data feed or broker.
- An account to run it on. Start on Sim101. Move to a live or prop account only after you've watched it run.
Don't have NinjaTrader yet? Create a free NinjaTrader account. Affiliate link. FSD-X may earn a commission.
1. Install
- Download the .zip above. Don't unzip it.
- In the NinjaTrader Control Center, go to Tools → Import → NinjaScript Add-On.
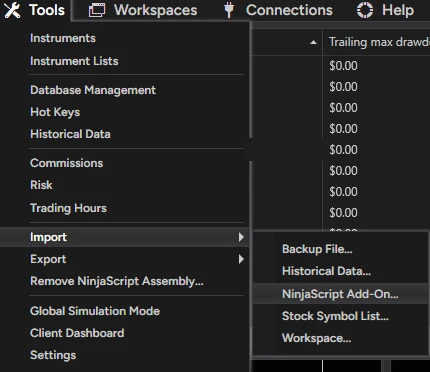
- Select the .zip and click Open. Confirm the import message.
- Restart NinjaTrader. Your license is checked when you log in.
2. Chart settings
Don't skip this step. Grades, stops and targets depend on these exact settings. Wrong data = wrong trades.
| Setting | Value | Where |
|---|---|---|
| Merge policy | Merge non back adjusted | Tools → Settings → Market data |
| Instrument | MNQ or NQ, current front month | Chart → Data Series |
| Price based on | Last | Data Series |
| Bar type | Minute, value 5 | Data Series |
| Load data based on | Days | Data Series |
| Days to load | 365 | Data Series |
| Trading hours | CME US Index Futures ETH | Data Series |
A. Set the merge policy (once per install)
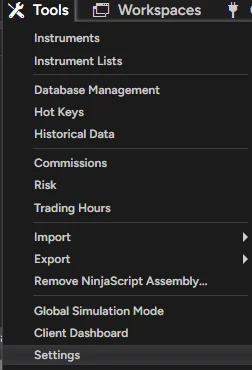
- In the Control Center, open Tools → Settings (called Options in some builds), then Market data.
- Under Historical, set Global merge policy to Merge non back adjusted. Leave Get data from server ticked.
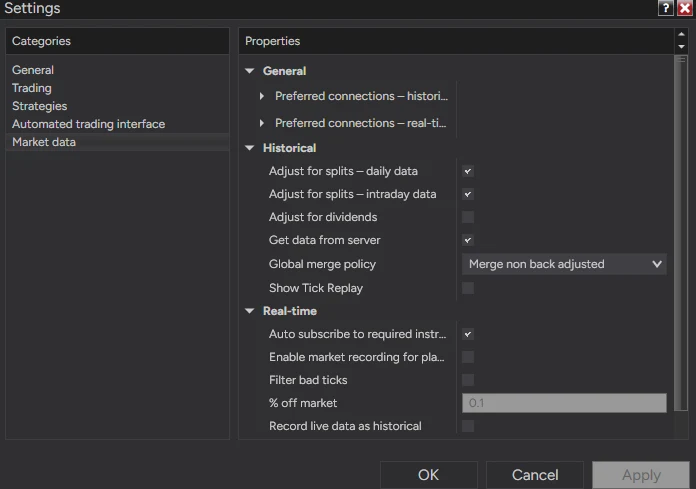
- Click OK. If a chart is already open, right-click it → Reload All Historical Data (Ctrl+Shift+R).
B. Set up the chart
- Open a chart: New → Chart in the Control Center, and pick MNQ or NQ, current front month.
- Right-click the chart → Data Series… (Ctrl+F).
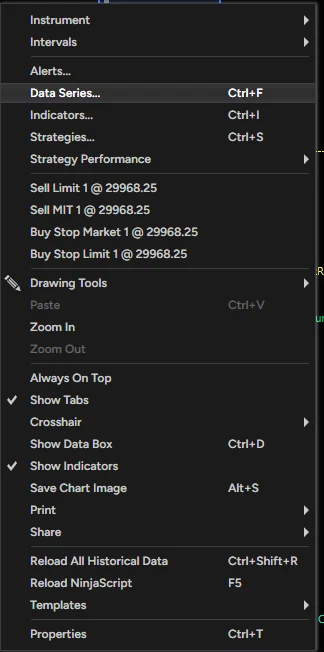
- Set every value from the table above: Last, Minute, 5, Days, 365, CME US Index Futures ETH. Leave End date on today.
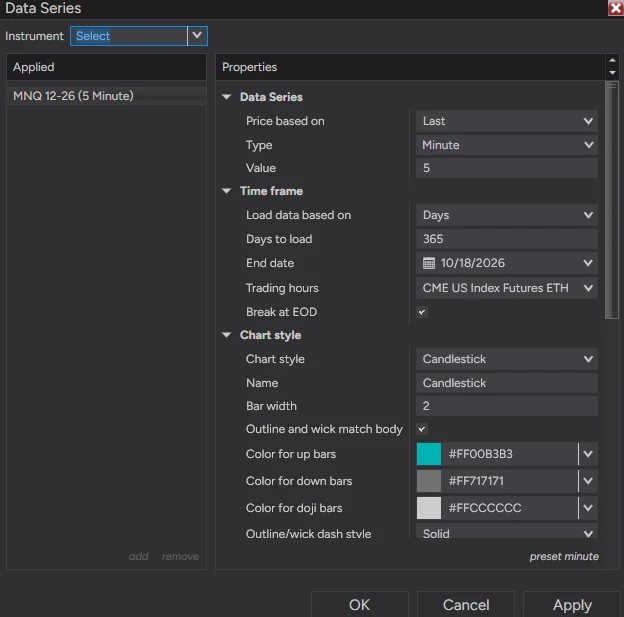
- Click OK. Give it a moment to load a full year of 5-minute bars.
C. Save it so it always loads right
- Save the Data Series as your default. In the Data Series window, click preset at the bottom right → Save as default. New 5-minute charts now open with 365 days and ETH.
- Save the workspace. After the strategy is added (step 3), go to Control Center → Workspaces → Save Workspace. NinjaTrader reopens this chart with these settings next time.
- Each new session, glance at the dashboard. If it shows a red WARMING UP or ETH warning, the chart isn't on these settings.
Why 365 days: the strategy reads a 4-hour trend, a 5-day ORB average and a 14-day volatility average. A short chart gives wrong grades and targets. The dashboard shows WARMING UP in red until enough history loads.
3. Add the strategy
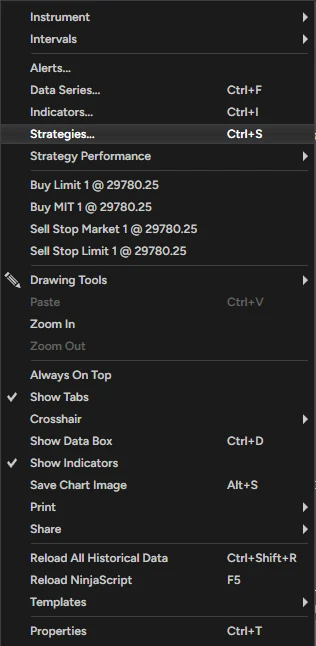
- Right-click the chart → Strategies… (Ctrl+S).
- Under Available, double-click KnightfallORB. It moves to Configured and its settings open on the right, starting with 0. Variant and 1. Risk Management.
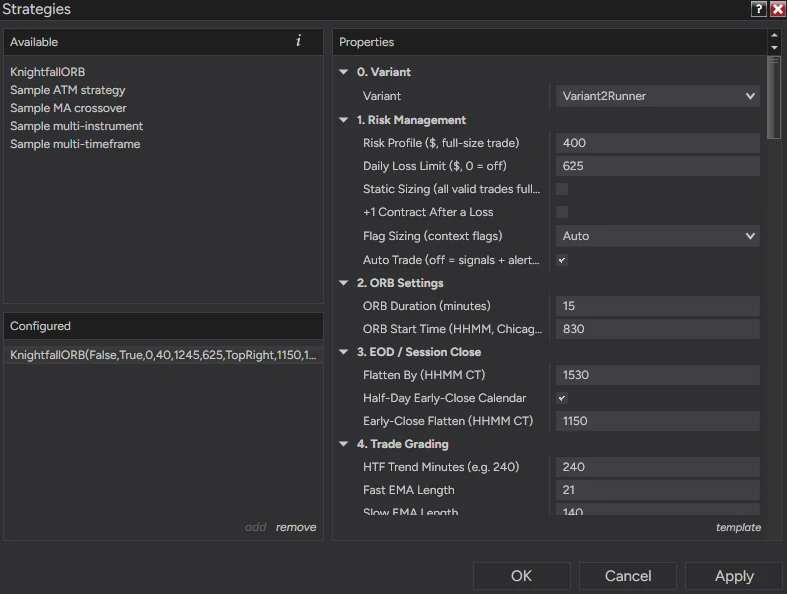
- Before you enable, check these five:
- Variant: loads as Variant 2 Runner. Keep it unless you have a reason to change it.
- Risk Profile ($): loads at $250. Change it to fit your account (recommended settings).
- Daily Loss Limit ($): loads at 0 (off). Set it: $500 at $250 risk, $700 at $400, about 1.5–2× risk otherwise.
- Auto Trade: on = it places and manages the trades for you. Off = signals only (popup and sound with direction, grade, contracts, entry, stop and TP1), and you place the trade yourself.
- Account: the exact account it will trade. Use Sim101 first. On a fleet, double-check you picked the right one.
- Leave Start behavior on Wait until flat. If you enable it mid-session, it waits instead of jumping into a trade already running.
- Scroll to the bottom of the settings. Tick Enabled, then click OK. Leave the rest of the NinjaTrader defaults (Calculate, Order handling) as they are.
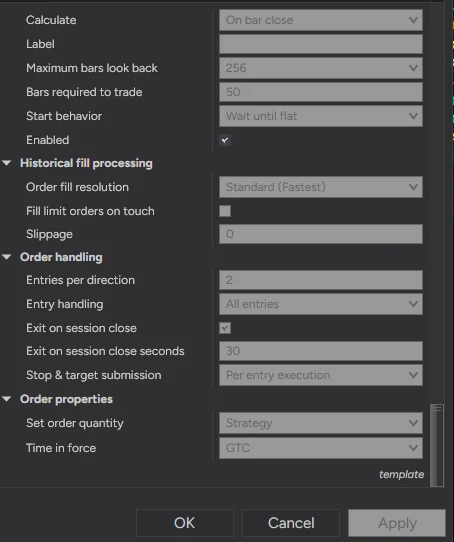
- Save your workspace: Control Center → Workspaces → Save Workspace. The chart, its data settings and the strategy reload together next time.
Changing settings restarts the strategy. If the chart markings disappear, open Strategies and check Enabled is still ticked.
Want alerts on your phone? Optional: set up Discord alerts →
One strategy per account. Don't place manual trades on an account it's trading. For several accounts, enable it on each one or use a trade copier.
4. Check and go live
- Check the dashboard: v1.4.9 in the header, your variant and risk in the config strip, the right account, and no red warning rows. Reading the dashboard →
- Run it on Sim101 first for at least a few sessions. Check entries, stops, targets and the 3:30 PM flatten.
- Keep NinjaTrader running and connected during the session. It only manages trades while it's running. A VPS is recommended.
- Built-in safety: flattens at 3:30 PM CT (and before half-day closes), NinjaTrader's session-close exit runs as a backup, and if an order is rejected it cancels, flattens, turns itself off and alerts you.
- Rollover: a red ROLLOVER warning shows about 8 days before expiry. Switch the chart to the next contract month and re-enable.
- You're responsible for your account. Watch it, especially the first weeks. Check your prop firm's rules on automation before running it there.
Recommended settings
Defaults, what we run, and every setting explained.
Defaults and what we run
What loads by default, what we run, and how to size it for your account. You set these in the Strategies window (Setup step 3).
When you first add KnightfallORB, you get:
The defaults are ready to run except the Daily Loss Limit. Set that before you enable.
What we run on V2 Runner. Change the risk to fit your account size.
| Risk Profile | Daily Loss Limit | Flag Sizing |
|---|---|---|
| $250 | $500 | Auto (off) |
| $400 | $700 | Auto (on) |
| Other sizes | About 1.5–2× your risk | Auto (on from $400) |
Side lock on. Same rule if you run V1. Pick the risk where the backtest drawdown fits your account. Size it on the results page →
Variants and every setting
Settings are grouped in order: 0. Variant first, then 1. Risk Management. Variant picks how the strategy exits and locks the rest of the strategy settings to tested values. Every variant runs the New York open: 8:30 CT, 15-minute ORB. Risk, sizing, the daily loss limit, the side lock, Auto Trade and every display setting always stay yours.
Since v1.4.3, settings a variant locks are tagged · Custom only or · Custom / V3 in their name. In V1, V2 and V3 they have no effect. The Locked To line under Variant says what is locked.
| Variant | What it does |
|---|---|
| V2 Runner | What we run. Full size to TP2 with a trailing stop that starts at TP1 (60 pt distance, TP2 min R:R 2, TP1 offset 20, TP2 offset 25). Retuned in v1.4.4: slower 4H trend read (EMA 32 / 200), max 2 trades a session, entries until 1:00 PM CT. Flag Sizing Auto (on at $400+). Selected by default when you first add the strategy. |
| V1 Stock | The original Knightfall. Takes profit at TP1. |
| V3 Fixed Stop | Experimental. Every stop is the Fixed SL (default 30 pts) and the exit settings stay editable. It tested worse than V2 on the New York session; it's here for other sessions and markets. |
| Custom | Every setting is editable. Starts at the V1 values. For your own testing. To run the pre-v1.4.4 V2, use Custom with the old values from the variant settings page. |
The No-Hedge ORB Cap is locked on in V1, V2 and V3: a stop never sits past the far edge of the opening range. That means accounts running different variants can never be long and short at the same time. Only Custom can turn it off.
| Your settings | Default | What it does |
|---|---|---|
| Auto Trade | On | On = places live orders. Off = signals only: a popup and sound with direction, grade, contracts, entry, stop and TP1. You place the trade yourself. |
| Risk Profile ($, full-size trade) | 250 | Dollar risk on a full-size trade. Used to size each trade. Contract value is read from the instrument: MNQ or NQ, nothing to set. |
| Daily Loss Limit ($) | 0 (off) | Set your own. Stops new entries for the rest of the day once closed losses reach this amount. Never closes an open trade. We use about 1.5–2× risk. |
| Daily Profit Cap ($) | 0 (off) | Optional (v1.4.8+). Stops new entries once the day’s realized profit reaches this, and pulls an open trade’s final target in so the day can’t go past it. For prop consistency rules, set it under the firm’s limit. The account row shows CAP $made/$cap. |
| Trade Profit Target ($) | 0 (off) | Optional (v1.4.8+). Replaces the trade’s final target (TP2 in V2, TP1 in V1) with the price that makes this many dollars at the trade’s size. Can be closer or farther than the normal target. The dashboard shows it in orange as $tgt. Fills can slip past a target, so keep a buffer under your firm’s limits. |
| Flag Sizing | Auto | Halves size when 2 or more warning flags show on a breakout, never below 1 contract. Never skips a trade. Auto = on in V1 and V2 when Risk Profile is $400 or more, off below $400, always off in V3 and Custom. Off and Half At 2 Flags force it either way. |
| Lock Side If First Breakout Fails Gate | On (every variant) | If the first breakout of the day on a side fails the evidence gate, that side is done for the session. The dashboard shows the reason. Variants never lock this one, so you can turn it off in any variant. |
| Static Sizing | Off | On = every valid trade gets full size regardless of grade |
| +1 Contract After a Loss | Off | Adds one contract to the next trade after a loss |
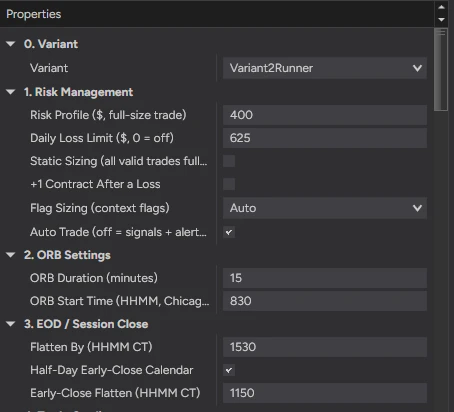
Locked by every variant: ORB 8:30–8:45 CT, Minimum Grade C, Flatten By 3:30 PM CT (11:50 AM on half-days). V2 Runner (retuned in v1.4.4): max 2 trades per session, entry cutoff 1:00 PM CT. V1 and V3: max 3 trades, cutoff 12:45 PM CT. Display settings only change what's drawn. They never affect trades. Every locked value →
Every locked value, by variant
Want to test your own version? Set Variant to Custom and start from a tested column. Every value V1, V2 and V3 lock, with the same names as the settings window, is on one page for NinjaTrader and TradingView.
Trail Mode (Custom and V3)
V2 sets its own trail. In V1 the trail is off. These settings only apply in Custom and V3. Backtest any change before you use it live.
| Setting | Default | What it does |
|---|---|---|
| Trail Mode | Off | Off: stop stays put. BreakevenOnly: moves the stop to entry once the trigger is hit. TrailOnly: trails the stop behind price. BreakevenThenTrail: breakeven first, then trails. |
| Trigger Units | Points | Points, % of the distance to TP1, or % of the distance to TP2 |
| Breakeven Trigger | 40 | How far in profit before the stop moves to entry |
| Breakeven Offset | 0 | Points past entry to place the breakeven stop |
| Trail Trigger | 50 | How far in profit before trailing starts |
| Trail Distance | 30 | How far behind price the trailing stop sits |
Discord alerts (optional, v1.4.6+)
Knightfall can post to your own Discord server so you can follow along away from your computer. It's off until you paste a webhook URL. Leave it blank and Knightfall runs exactly as before. It never changes how trades are taken or managed.
- Make a webhook. In your Discord server, open the channel's settings (gear icon) → Integrations → Webhooks → New Webhook → Copy Webhook URL.
- Paste it. In NinjaTrader, open Strategies, select KnightfallORB, scroll to 11. Discord Alerts and paste it into Discord Webhook URL.
- Enable the strategy. When it goes live you get a Knightfall connected message with your variant, risk, account and AUTO or MANUAL. That confirms it works.
| Setting | Default | What it sends |
|---|---|---|
| Discord Webhook URL | Blank (off) | Where to post. Blank = nothing is sent |
| Send Breakouts | On | Each breakout with its grade, TAKE or SIGNAL, and the levels |
| Include NO TRADE Breakouts | Off | On = also breakouts it skipped, with the reason |
| Send Entries and Exits | On | Entry fills, partial exits, and the final exit with gross P&L (before commission) |
| Send Daily Loss Limit Hit | On | When the Daily Loss Limit (or the Daily Profit Cap) stops new entries for the day |
| Heartbeat (minutes, 0 = off) | 30 | v1.4.8+. “Knightfall running” every 30 minutes from the ORB start to the flatten time on weekdays, with flat or in-trade status. Turns yellow if no market data has come in for 5+ minutes. If the pings stop, check your PC. |
- Live only. Nothing is sent for historical bars or chart reloads.
- Playback and replay count as live. Clear the URL before you replay, or it will post the replay trades.
- Keep the URL private. Anyone with it can post in that channel. Don't share templates or workspaces that contain it.
- Knightfall stopped (v1.4.8+) posts when the strategy is disabled, removed or NinjaTrader closes, with the order error if NinjaTrader turned it off. A crash or power cut can’t send anything, which is what the heartbeat is for.
- Discord down? Messages run in the background. A Discord outage never affects a trade.
- Several accounts? Each enabled copy posts its own messages. Use one channel per account, or paste the URL on one copy only.
Reading the dashboard
What each row and chart marking means.
Dashboard and chart
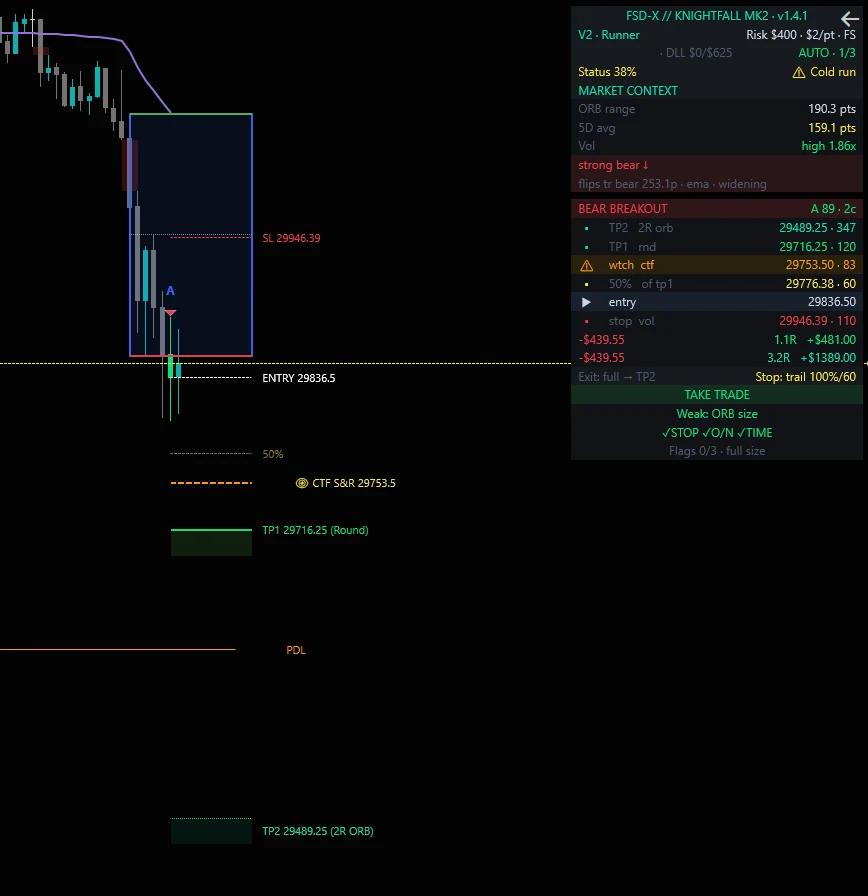
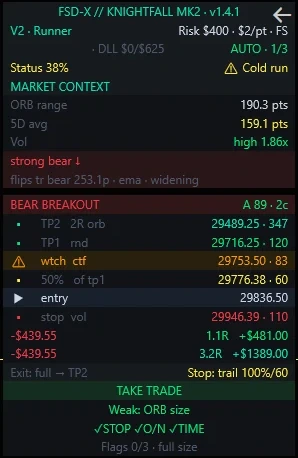
The dashboard sits top right. Red rows at the top are warnings. Fix them before trading.
| Row | What it shows |
|---|---|
| Header | Strategy name and version (v1.4.9). Match it to the version on this page. |
| Config strip | Variant (with locked, or exits live in V3) · Risk Profile · $/pt · FS when Flag Sizing is on · GL off when the side lock is turned off |
| Account row | The account it's trading (check it's the right one) · DLL closed loss today / your limit, e.g. DLL $0/$700 · AUTO or MANUAL · trades today out of the session max (2 in V2, 3 in V1 and V3). The DLL turns yellow with low or high when the limit is under 1.5× or over 2.5× your Risk Profile. A sizing hint, not an error. With a Daily Profit Cap set, the row adds CAP $made/$cap (yellow low when the cap is under 2× your Risk Profile). Once the loss limit or the cap is hit, it reads AUTO · done today. |
| Status | Win rate of the last 40 trades against the normal 52–72% band: Normal, Cold run or Hot run. Information only. It never changes size or stops trading. |
| ORB range | Size of today's opening range (8:30–8:45 CT), in points |
| 5D avg | Average ORB of the last 5 sessions. Green = ideal band, yellow = outside it, red = extreme |
| Trend row | The 4-hour trend. [shift?] means the current 4-hour bar is leaning toward a different state |
| Breakout header | Direction, grade, score and contracts at your risk setting |
| Flag rows | Which warning flags are showing (STOP: a prior day/week level inside the stop · O/N: overnight move against the 4H trend · TIME: entry 15–60 min after the ORB), the count out of 3, and the size result, e.g. Flags 2/3 · HALF 2→1c |
| TP1 / TP2 / stop | Levels, what set them and distance in points. The dollar rows show the stop loss and each target's R and dollar amount at your size. When Trade Profit Target or Daily Profit Cap moves the final exit, an orange $tgt or cap row replaces the target it moved, with its own R and dollars, and an orange $ TGT / DAY CAP line marks it on the chart while the trade is open. |
| Exit row | How the variant exits, e.g. Exit: full → TP2 and Stop: trail 100%/60 in V2. Adds · $ tgt or · day cap when a $ setting moved the exit. |
| TAKE TRADE / NO TRADE | Whether the setup passes every rule, with the reason underneath |
| Side lock | Shows when a side is locked for the day and why: grade, counter-trend, ranging or below-gate |
Less room on screen? Set 9. Dashboard → Layout to Compact (v1.4.5+). It shows less data: version, variant and risk in one header, the account row, trend and ORB 62 / 58 on one row, then TAKE or NO TRADE with entry, stop, TP1 and TP2. The reason only shows on a NO TRADE or a locked side. Red warning rows always show. Background Transparency % lets the chart show through (40–60 stays readable).
Live preview: while the breakout candle is still forming, the grade, levels and verdict update live, and the candle is colored by its current grade. The grade is final when the candle closes. That's when the strategy enters. If price falls back inside the range first, the preview clears.
| Marking | Meaning |
|---|---|
| Blue box | Today's opening range. High in green, low in red |
| Triangle + letter | A breakout and its grade (A+ to F) |
| Colored candle | A tradeable setup: lime A+/A, green B+/B, yellow C+/C. No color = not valid |
| White / red dashed | Entry and stop |
| Green line + box | TP1 |
| Teal dotted line + box | TP2 |
| Yellow dashed | 50% of the way to TP1 |
| Orange dashed | Watch level |
| Faded short stubs | Levels of your open trade after a newer breakout moved the main lines |
One setup is drawn at a time. Setup lines clear at the 5 PM CT session roll.
FSD-X // Volume v2.0
Install it, add it to the chart, read the bars and the profile.
1. Install and add it
- Download the Volume .zip from your tools above. Don't unzip it.
- Control Center → Tools → Import → NinjaScript Add-On. Pick the zip, confirm, then restart NinjaTrader.
- On your MNQ or NQ chart, right-click → Indicators… (Ctrl+I). Double-click FSDXVolume. It draws on the price panel: volume bars along the bottom, the profile on the left.
- Use the same chart settings as Knightfall: 5-minute bars, CME US Index Futures ETH trading hours. Chart settings →
- Click OK, then save your workspace.
Updating from v1.0? After the import and restart, remove FSD-X // Volume from your chart and add it again. v1 sat in its own panel; v2.0 draws on the price chart. Your ORB settings carry over.
Volume works on its own, or alongside Knightfall on the same chart.
2. Reading the bottom bars
Every bar is volume, drawn see-through along the bottom of the price chart. The color tells you what part of the session it's in, and whether it was a breakout bar. Brighter = at or above the average line. Faded = below it.
| Color | Meaning |
|---|---|
| Green | Bull breakout bar: opened inside the opening range, closed above it and above VWAP |
| Red | Bear breakout bar: opened inside the opening range, closed below it and below VWAP |
| Yellow | The opening range window (8:30–8:45 CT by default) |
| Teal | Regular session after the opening range |
| Gray | Pre-market and after hours (after 4 PM CT) |
| White line | Average volume over the last 20 bars |
Only the first breakout on each side is marked. A side re-arms after price closes back inside the range. Breakout marking runs for 6 hours after the opening range ends. The live bar can change color until it closes, same as TradingView. Closed bars never repaint.
3. Reading the profile
The profile shows how much volume traded at each price, docked to the edge of the chart. Longer row = more volume at that price.
| Part | Meaning |
|---|---|
| Teal rows | Volume at each price over the profile range (the current session by default) |
| Yellow layer | The part of that volume that traded during the opening range |
| Orange row and line | Point of control (POC): the price with the most volume in the range |
The profile is built from the chart's bars, with each bar's volume spread across its high and low. On 1–5 minute charts it's close to a tick profile.
4. Settings
The defaults match Knightfall on the New York open. If you change your opening range in Knightfall, change it here too.
| Setting | Default | What it does |
|---|---|---|
| Profile | ||
| Profile side | Left | Left, Right, or Off |
| Profile range | Session | Session = current session. ORB onward = from the opening range. Visible bars = what's on screen |
| Width (% of chart) | 18 | How far the longest row reaches into the chart |
| Row height (px) | 3 | Smaller = more detail |
| Opacity % | 40 | How see-through the profile is |
| Show ORB-window layer | On | Yellow layer for opening range volume |
| Point of control | ||
| Show POC | On | Marks the price with the most volume |
| Extend POC line across chart | On | Off = the line stays under the profile |
| Show POC price label | On | Shows the POC price next to the profile |
| Bottom bars | ||
| Show volume bars along the bottom | On | The breakout / session volume bars |
| Height (% of chart) | 18 | How tall the tallest bar gets |
| Opacity % | 55 | How see-through the bars are |
| ORB settings (same as v1.0) | ||
| ORB Start Time (HHMM CT) | 830 | Start of the opening range, Chicago time |
| ORB Duration (Minutes) | 15 | Length of the opening range |
| Volume Average Length | 20 | Bars used for the average line, and for bright vs faded |
| Show Average Line | On | Draws the average volume line over the bottom bars |
| Show Session Zone Colors | On | Off = every non-breakout bar is teal |
| Breakout Close Override | On | Only marks a breakout when the close lands inside the min/max distance below |
| Min Close Outside ORB (pts) | 0 | How far past the range edge the bar must close. 0 = any close outside |
| Max Close Outside ORB Filter | On | Skips extended candles that close too far outside the range |
| Max Close Outside ORB (pts) | 50 | Furthest close past the range edge that still counts |
FSD-X // ORB Raven
Install it, set up the chart, read the dashboard. Indicator only: it never places orders.
1. Install and add it
- Download the Raven .zip from your tools above. Don't unzip it.
- Control Center → Tools → Import → NinjaScript Add-On. Pick the zip, confirm, then restart NinjaTrader.
- On your MNQ or NQ chart, right-click → Indicators… (Ctrl+I). Double-click RavenORB. It draws on the price panel.
- Set Risk Per Trade ($) to the dollar risk you want sized. It loads at $400.
- Click OK, then save your workspace (Workspaces → Save Workspace).
Raven runs only on a NinjaTrader account licensed for Raven. Import works without a license, but nothing draws until your license is active. Raven can sit on the same chart as Knightfall.
2. Chart settings
Same as Knightfall. Full chart settings →
- 5-minute bars, price based on Last.
- Trading hours: CME US Index Futures ETH.
- Days to load: 365. The stop and range averages need the history. Until it's loaded, the dashboard shows a red WARMING UP row.
- Merge policy: Merge non back adjusted.
If the chart is wrong, Raven tells you: red rows for Built for 5-minute bars, Use ETH trading hours, or a ROLLOVER warning near contract expiry. Levels won't match TradingView until those are fixed.
3. What it draws
Every opening range breakout, both directions. No grading and no filters. Which ones to take is your call.
| On the chart | What it is |
|---|---|
| ORB box, lines and midline | The opening range (8:30–8:45 CT by default) |
| Entry, Stop | Drawn when a breakout bar closes. Same stop engine as Knightfall, including the No-Hedge ORB Cap |
| TP1, TP2 | Targets from Smart TP, tagged with the level they came from (PDH/PDL, weekly, S/R, FVG, round number) |
| 50% line | Halfway from entry to TP1 |
| Watch level | A significant nearby reference level |
| Ghost lines | Faded levels from the previous breakout on the same side, so a setup you're already in stays readable |
| Purple line | VWAP |
The dashboard shows the version and your risk / $ per point in the header, then trend and ORB vs average, then each breakout with entry, stop, TP1, TP2 and contracts. $ per point is read from the instrument (MNQ 2, NQ 20). Contracts = risk ÷ (stop distance × $ per point), minimum 1.
Layout: Compact shows only the header, trend, ORB vs average, and entry, stop, TP1, TP2 and size. Use it on small screens. Setup warnings always show in both layouts.
4. Settings worth knowing
The defaults match Raven on TradingView. Change the levels settings only if you know why.
| Setting | Default | What it does |
|---|---|---|
| Risk Per Trade ($) | 400 | Dollar risk used to size contracts |
| ORB Start Time / Duration | 830 / 15 | Opening range, Chicago time |
| Session End (HHMM CT) | 1530 | No new breakouts after this time |
| Minimum / Maximum SL (points) | 75 / 175 | Limits on how close or far the stop can sit |
| No-Hedge ORB Cap | On | The stop never sits past the other side of the range. Matches Knightfall |
| Show ORB Lines / Setup Lines | On | Turn the range or the entry/stop/target lines off to declutter |
| Light Mode (dark text) | Off | For light chart backgrounds: light dashboard, dark text |
| Layout (Full / Compact) | Full | Compact for phones and small panes |
| Background Transparency % | 0 | 0 = solid. 40–60 lets the chart show through and stays readable |
| Font Size | 12 | Dashboard text size |
| Alert on Breakout | Off | On = an alert in the Alerts window when a breakout bar closes, with entry, stop, TP1, TP2 and contracts. Live only. Raven alerts on every breakout |
Troubleshooting
Fixes for the common setup problems.
Common questions
Tap a question.
Still stuck?
Send a screenshot of the problem and your NinjaTrader email.
Updates
Release notes for every tool, how to update, and older versions.
What's new
No release published yet.
How to update
- When a new version is out, you'll see Update available at the top of this page and on that tool's card.
- Download it, then Tools → Import → NinjaScript Add-On and pick the new zip. Say yes to replace.
- Restart NinjaTrader. Your license carries over.
- Knightfall: remove the strategy from the chart and add it again so the new defaults load. Check Variant, Risk Profile and Daily Loss Limit before you enable it. Indicators like Volume and Raven pick up the update after the restart. Raven: if the dashboard looks off, remove it and add it again.
- Save the workspace again (Workspaces → Save Workspace).
Previous versions
Only use an older version if support asks you to.